How Rightroute Ranks Areas: The Data Behind the Scores
Rightroute Team
· Data & Research
· 31 March 2026
Most area comparison tools are black boxes. They hand you a number out of ten and leave you to guess what went into it. Every town on Rightroute carries a score out of 100, and this post sets out exactly what that number is made of, how each measure gets onto a common scale, and why the same town can score differently depending on what you care about.
The problem with a single ranking
The UK has no shortage of "best places to live" lists. They are useful starting points, but they share a flaw: they weight every factor the same way for every reader.
For someone in the office five days a week, commute time dominates. For a remote worker who goes in twice a month, it barely registers, and the season ticket matters more than the journey. For a buyer at the edge of their budget, the asking price decides everything. One universal ranking cannot serve all three, which is why you can change how much each measure counts towards the score.
The seven measures
The 187 towns we track are scored on up to seven things, whether they commute into London, Bristol, Manchester or Birmingham. All seven are measured figures rather than opinions, which is the main reason the number is worth anything. Not every town has all seven: 119 do, and the rest are missing one or two, most often a season ticket, which we only hold for the London ring. Where a measure is missing it drops out and the others carry the score, and the town's own page says which ones it was scored on.
Train time into the city
Typical direct journey time to the town's main terminal in its city, in minutes. It goes onto the 0 to 100 scale against a 90 minute ceiling, so a 20 minute commute scores 78 and an 80 minute one scores 11. Anything beyond 90 minutes scores zero rather than going negative.
Annual season ticket
The published annual season ticket into London. There is no open fares feed, so this is the one measure held by hand, and only for the London ring: no Manchester or Birmingham town has one, and those towns are scored on the other six. It scales between £2,000 and £9,500, which covers the real range. This sits separately from commute time on purpose. A short journey on an expensive line and a long journey on a cheap one are different trade-offs, and collapsing them into one number would hide that.
House price against local earnings
Not the asking price on its own. We take the town's average sold price and divide it by the median full-time wage in its local authority, which gives the number of years' pay an average home costs. Fewer years scores higher. This is the heaviest single input on the default weighting, because for most people looking at commuter towns it is the binding constraint.
It used to be the price by itself, on a fixed scale running from £150,000 up to £800,000. That was set from the London commuter belt, and it quietly rewarded towns for being northern: every town we track around Manchester sits in the cheaper half of that range, so all of them scored well on price whatever the local wage was. A £195,000 house in Bolton and a £591,000 house in Sevenoaks are not really six years' pay and sixteen years' pay apart because one is cheap, they are that far apart because pay is different in the two places. Dividing by local earnings is what lets towns in different parts of the country sit in the same ranking honestly.
Earnings come from the ONS, who publish a median wage for every local authority in England and Wales once a year. Prices refresh monthly, so the ratio moves with the housing market rather than sitting still between annual updates.
Safety
A crime index from 0 to 100 where lower is safer, inverted so that a safer town scores higher. It is an area level figure, so it describes the town rather than any particular street.
Some towns have no figure at all. Police forces report their street level crime to a national service voluntarily, and Greater Manchester's does not, so we have nothing to show for the towns it covers. Where that happens we leave the measure blank and let the other six carry the score, rather than filling the gap with a zero that would read as the safest place on the list.
Broadband
The average download speed available in the area, from Ofcom, measured against a gigabit. Once a connection is fast enough to work on, more headroom stops changing the decision, which is why the scale tops out where it does rather than running up to whatever the fastest town happens to manage.
Parks and playing fields
Hectares of public park and playing field within 3 miles of the town centre, from Ordnance Survey's Open Greenspace data. It scales to a 600 hectare ceiling, which sits just above the 85th percentile of the towns we track. The cap is there for the same reason broadband has one: Slough carries over 2,000 hectares because Windsor Great Park falls inside its radius, and scaling to that would score almost every other town near zero.
Worth knowing what this does not cover. Open Greenspace maps managed, publicly accessible sites, so a small town ringed by open countryside scores low on it despite being surrounded by places to walk. Read it as parks rather than as countryside.
Historic landmarks
Nationally protected sites within 3 miles, from Historic England's National Heritage List: Grade I and Grade II* listed buildings, scheduled monuments, registered parks and gardens, battlefields and world heritage sites. It scales to a ceiling of 100.
Grade II listings are left out on purpose. They are the bulk of the register, so counting them would measure how many old buildings a place has rather than whether it has anything worth going to see, and a dense Georgian high street would out-count a town with a castle.
How the weighting works
Each measure lands on a 0 to 100 scale, then the seven are combined with weights that add up to one. Parks and landmarks take 5% each in all three presets. There are three:
- Balanced. Price against earnings 27%, commute 22.5%, season ticket 22.5%, safety 9%, broadband 9%, parks 5%, landmarks 5%. This is the default, and the score shown on every town report.
- Fast commute. Commute 36%, season ticket 27%, price against earnings 13.5%, then safety, broadband, parks and landmarks. Use it when the journey is the thing you cannot compromise on.
- Low price. Price against earnings 36%, season ticket 27%, commute 13.5%, then safety, broadband, parks and landmarks. Use it when the budget sets the shortlist.
Those first five percentages are the originals scaled down by a tenth to make room, rather than the new pair being bolted on top. The balance between commute, price, season ticket, safety and broadband is exactly what it was.
Switching preset reorders the whole list. That is the point rather than a quirk: the towns have not changed, the question has. A town that ranks 60th on balanced can sit inside the top 20 on low price, and knowing that is more useful than any single ordering.
Where the score appears
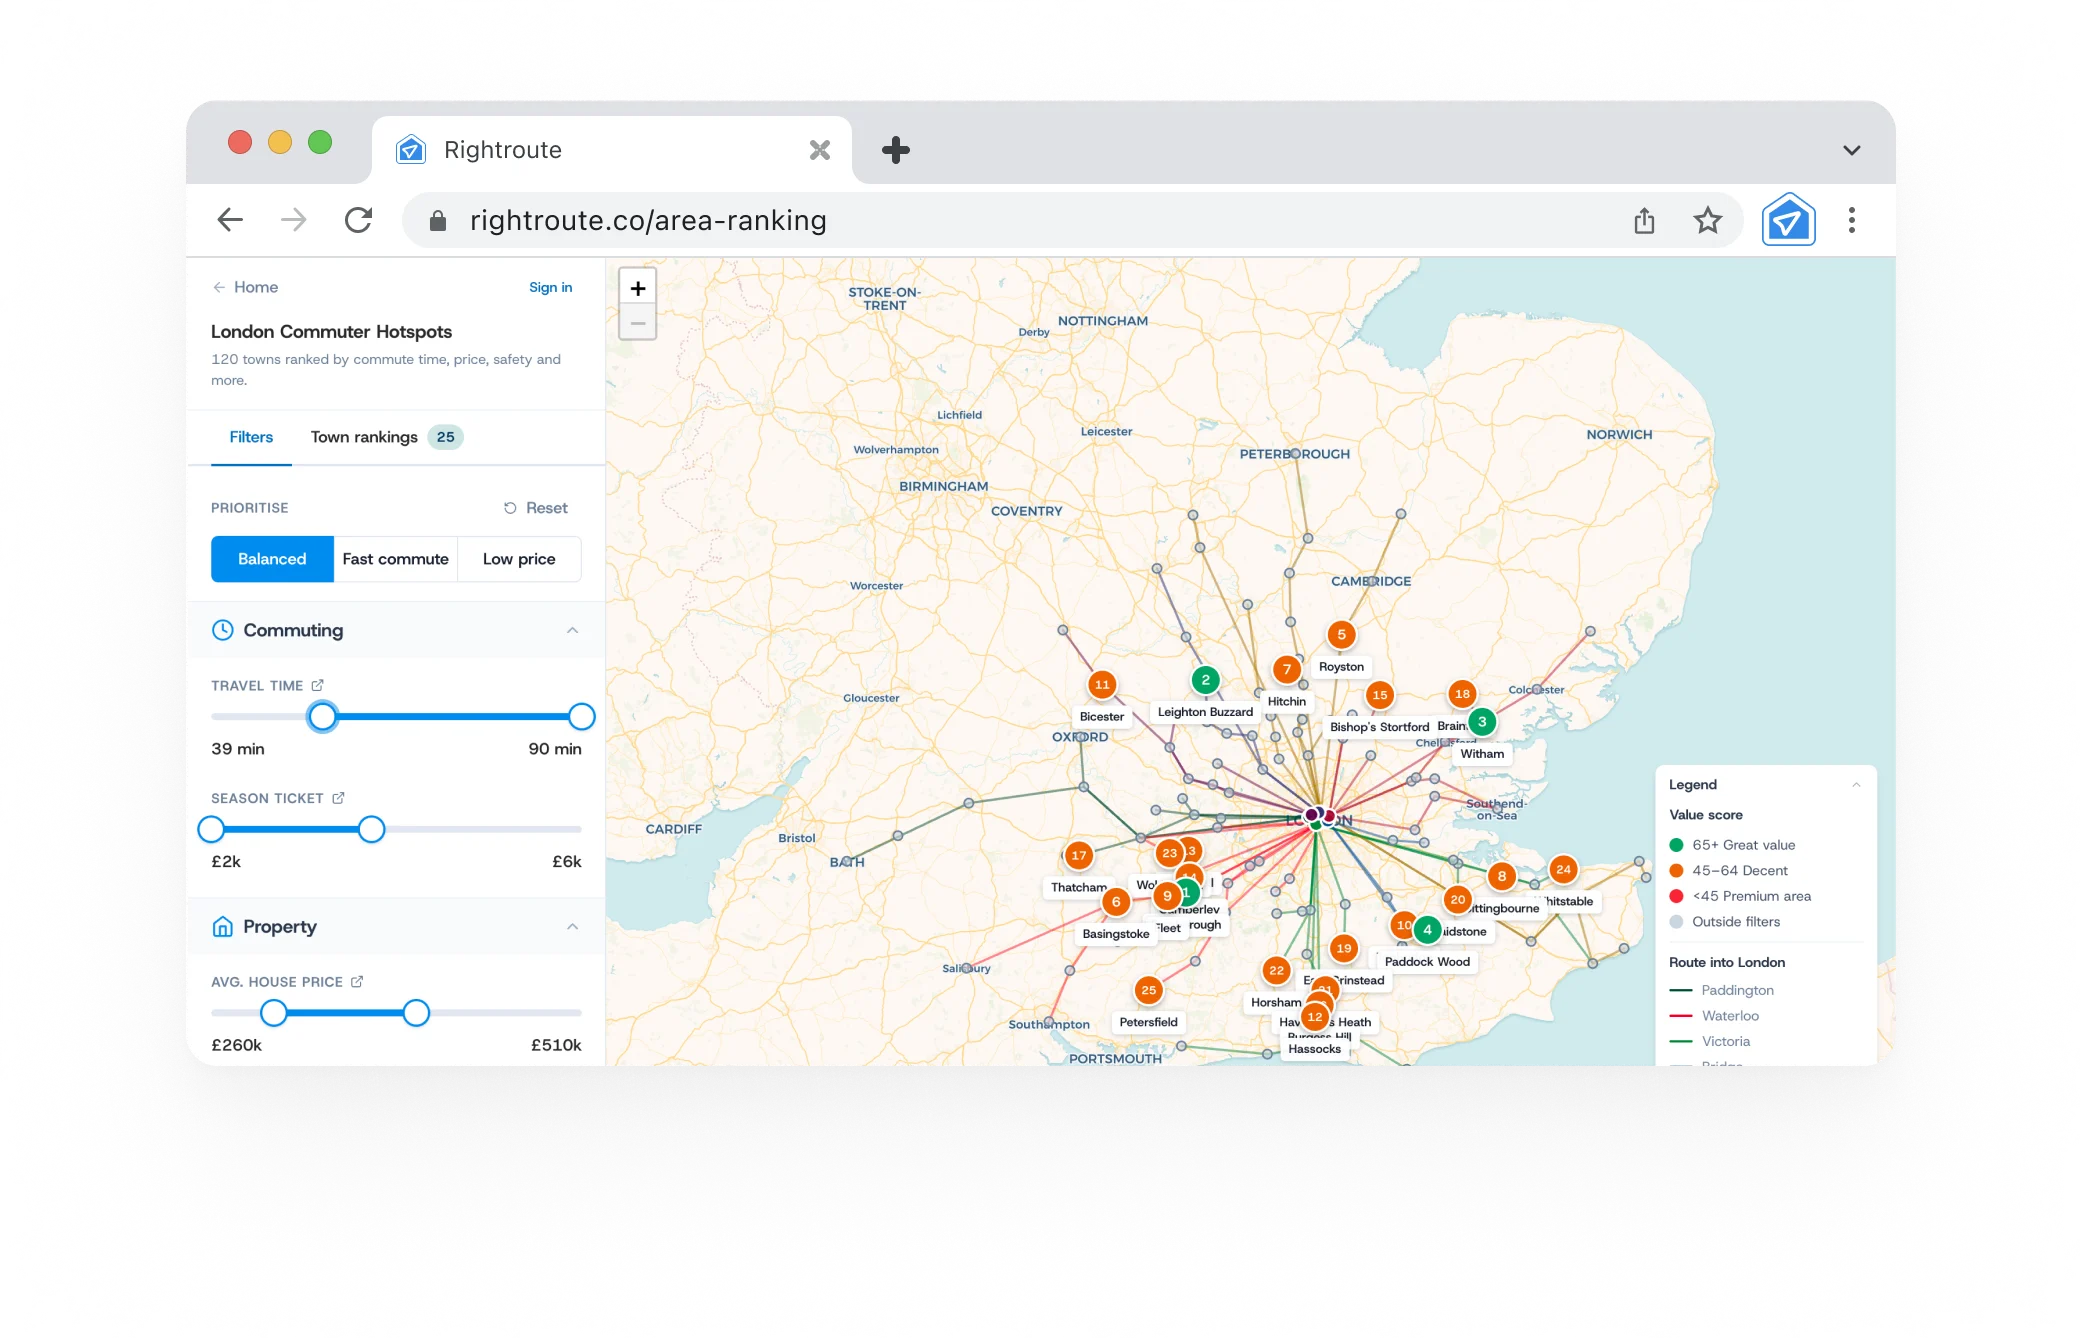
On a town report the score sits at the top as a gauge, with the town's rank out of the towns in its region underneath. On the commuter hotspots map it drives both the ranking and the colour of each pin, and the preset switcher is in the filters panel. If you want to read several towns against each other rather than one at a time, the comparison page stacks up to three side by side and marks the better figure in each row.
What the score does not do
Being transparent about the method means being honest about its limits.
- It does not predict the future. Price trajectories and planned infrastructure are not in it. A town scoring poorly on price today might be the better long term buy.
- It does not capture street level variation. Two roads in the same town can feel completely different. Every figure here is a town average.
- It does not cover schools or how a high street feels. Those matter, and they are missing because we do not yet have data on them we would be willing to put a number against for all 187 towns. We would rather leave a factor out than model it badly.
- It counts parks and landmarks, not cafe culture. Town reports also show how many places there are to eat and drink within 3 miles, and that figure is deliberately kept out of the score. Inside a fixed radius it largely measures how built up somewhere is, so weighting it would reward big towns for being big on top of the pull that price and commute already apply.
- It does not replace a visit. No set of numbers captures walking around on a Tuesday evening. Use the score to build a shortlist, then go and look.
How to use it
- Open the commuter hotspots map.
- Pick the preset that matches how you are actually deciding.
- Narrow the filters to the commute, budget and season ticket you can live with.
- Add the towns that survive to a comparison, up to three at a time.
- Open the full report on the ones you want to look at properly.
No account needed. Both the map and the comparison are free and there is nothing to sign up for.
Start with the map: rightroute.co/commuter-hotspots

